Realtime
Live signal, not five-minute-old graphs
Metrics and logs stream in under a second, so the dashboard reflects what's happening right now, not what happened at the last scrape.
STATUS · ALL SYSTEMS MONITORED
Pulseline watches your logs, deploys, and infrastructure in real time, then explains what broke in plain language and pages the right engineer automatically.
Trusted by engineering teams running
Capabilities
No dashboards to build. No alert rules to hand-tune for months. Connect a source and Pulseline starts making sense of it immediately.
Realtime
Metrics and logs stream in under a second, so the dashboard reflects what's happening right now, not what happened at the last scrape.
Automated
Pulseline correlates the deploy, the config change, and the error spike, then writes a plain-language summary before you've opened the laptop.
Observable
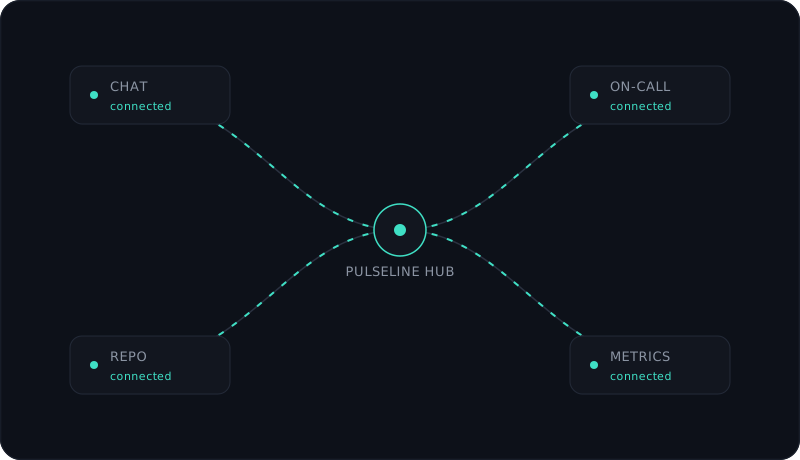
Chat, repo activity, on-call pages, and infra metrics land on a single timeline, so nobody stitches three tabs together during an incident.
Accountable
Every incident keeps its timeline, owners, and resolution notes, exported as a shareable report the moment it's closed.
Setup
Chat, repo, on-call rotation, and metrics provider. Read-only access, revoke anytime.
A few hours of traffic is enough to know what "normal" looks like for your system, so alerts start precise, not noisy.
The right person gets paged with context attached — not a wall of raw logs.
Pricing
Drag the sliders to match your team. The plan below updates live.
$0/mo
For side projects and small services finding their feet.
$129/mo
For growing teams that need real on-call coverage.
Custom
For platform teams with compliance and volume needs.
Customers
"Our mean time to resolution dropped from 40 minutes to under 8. The summaries alone paid for the plan."
"We turned off two other tools. Pulseline is the one thing on-call actually opens now."
"Setup took an afternoon. Within a week it caught a memory leak we'd missed for months."